Last Update: February 21, 2022
Multicollinearity is when two or more linear regression independent variables are highly correlated which complicates isolating their individual explanatory relationship with dependent variable
. This can be tested through model independent variables estimated variance inflation factors
. If independent variable
estimated variance inflation factor
is between five and ten then independent variable might be highly correlated. And, if independent variable
estimated variance inflation factor
is greater than ten then independent variable is highly correlated.
As example, we can fit a five-variable multiple linear regression with formula . Then, as example again, we can estimate independent variable
variance inflation factor individually with formula
. Independent variable
variance inflation factor
is equal to one divided by one minus coefficient of multiple determination
from multiple linear regression with formula
. Notice that multiple linear regression
only includes independent variables and independent variable
for which variance inflation factor
is estimated becomes its dependent variable while the others remain as independent variables.
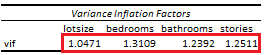
Below, we find an example of independent variables individually estimated variance inflation factors from multiple linear regression of house price explained by its lot size, number of bedrooms, bathrooms and stories [1].
Courses
My online courses are hosted at Teachable website.
For more details on this concept, you can view my Linear Regression Courses.
References
[1] Data Description: Sales prices of houses sold in the city of Windsor, Canada, during July, August and September, 1987.
Original Source: Anglin, P., and Gencay, R. (1996). Semiparametric Estimation of a Hedonic Price Function. Journal of Applied Econometrics, 11, 633–648.
Source: AER R Package HousePrices Object. Christian Kleiber and Achim Zeileis. (2008). Applied Econometrics with R. Springer-Verlag, New York.